Benchmarking AI Models on Mac M3 Max, Windows Desktop, and ASUS ROG SCAR: Battle of GPUs
Introduction
With AI models becoming more advanced, the hardware powering them plays a crucial role in delivering efficient performance. In this article, I set out to compare three powerful machines—Mac M3 Max, ASUS ROG SCAR, and Windows Desktop—using three AI models: Llama3.2:3B, Qwen2.5:7B, and Qwen2.5:14B. The primary goal is to highlight how NVIDIA GPUs, particularly the 4090, stack up against other configurations in terms of latency, throughput, and request handling capabilities.
Windows Desktop: NVIDIA 3060ti GPU, Intel i7-13700k, 64GB RAM.
Test Parameters
The benchmarking tool Bombardier was used with the following configurations:
Single Request Test: 1 connection, 100 requests.
Multi-Request Test: 10 connections, 100 requests.
Each test consisted of POST requests sent to a local AI inference endpoint, measuring performance across various dimensions.
Benchmark Results
Single Request Test: Llama3.2:3B
Machine
Avg Req/sec
Latency (Avg)
Throughput (KB/s)
Completion Time
Mac M3 Max
0.32
3.16s
11.05
5m15s
Windows Desktop
0.38
2.44s
14.49
4m3s
ASUS ROG SCAR
0.46
2.01s
17.46
3m20s
Single Request Test: Qwen2.5:7B
Machine
Avg Req/sec
Latency (Avg)
Throughput (KB/s)
Completion Time
Mac M3 Max
0.43
3.14s
6.76
5m14s
Windows Desktop
0.36
2.64s
8.12
4m23s
ASUS ROG SCAR
0.51
2.12s
10.24
3m32s
Single Request Test: Qwen2.5:14B
Machine
Avg Req/sec
Latency (Avg)
Throughput (KB/s)
Completion Time
Mac M3 Max
0.16
6.45s
3.55
10m45s
ASUS ROG SCAR
0.23
4.35s
5.45
7m15s
Multi-Request Test: Llama3.2:3B
Machine
Avg Req/sec
Latency (Avg)
Throughput (KB/s)
Completion Time
Mac M3 Max
0.48
21.74s
15.70
3m45s
Windows Desktop
0.92
11.42s
29.97
1m59s
ASUS ROG SCAR
1.20
8.30s
24.72
1m26s
Multi-Request Test: Qwen2.5:7B
Machine
Avg Req/sec
Latency (Avg)
Throughput (KB/s)
Completion Time
Mac M3 Max
0.41
23.66s
8.68
4m6s
Windows Desktop
0.86
11.92s
17.49
2m3s
ASUS ROG SCAR
1.20
8.30s
24.72
1m26s
Multi-Request Test: Qwen2.5:14B
Machine
Avg Req/sec
Latency (Avg)
Throughput (KB/s)
Completion Time
Mac M3 Max
0.20
49.31s
4.58
8m33s
ASUS ROG SCAR
0.60
15.70s
13.96
2m43s
Graphical Representation
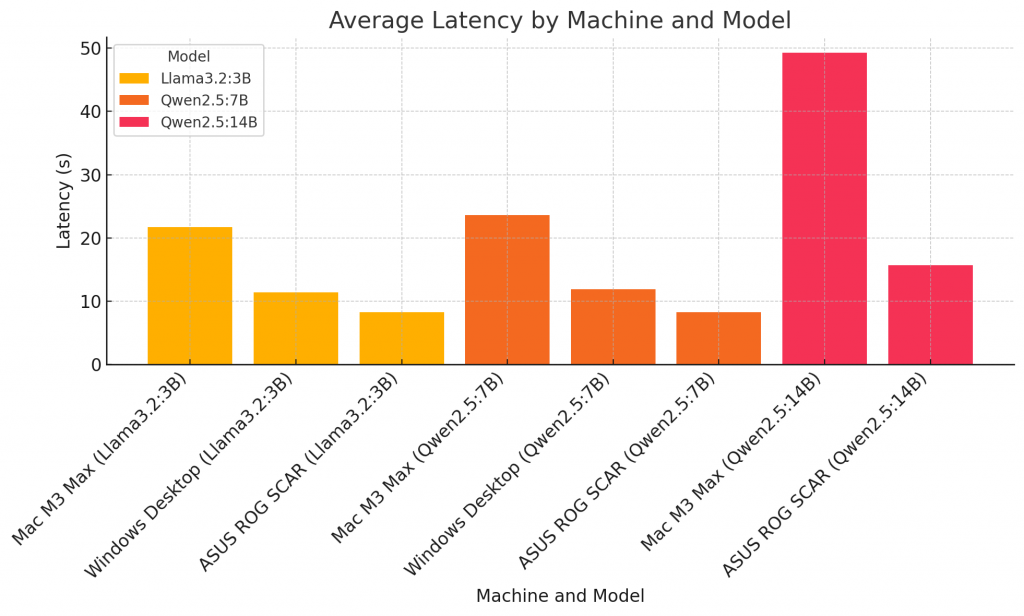
1. Average Latency by Machine and Model
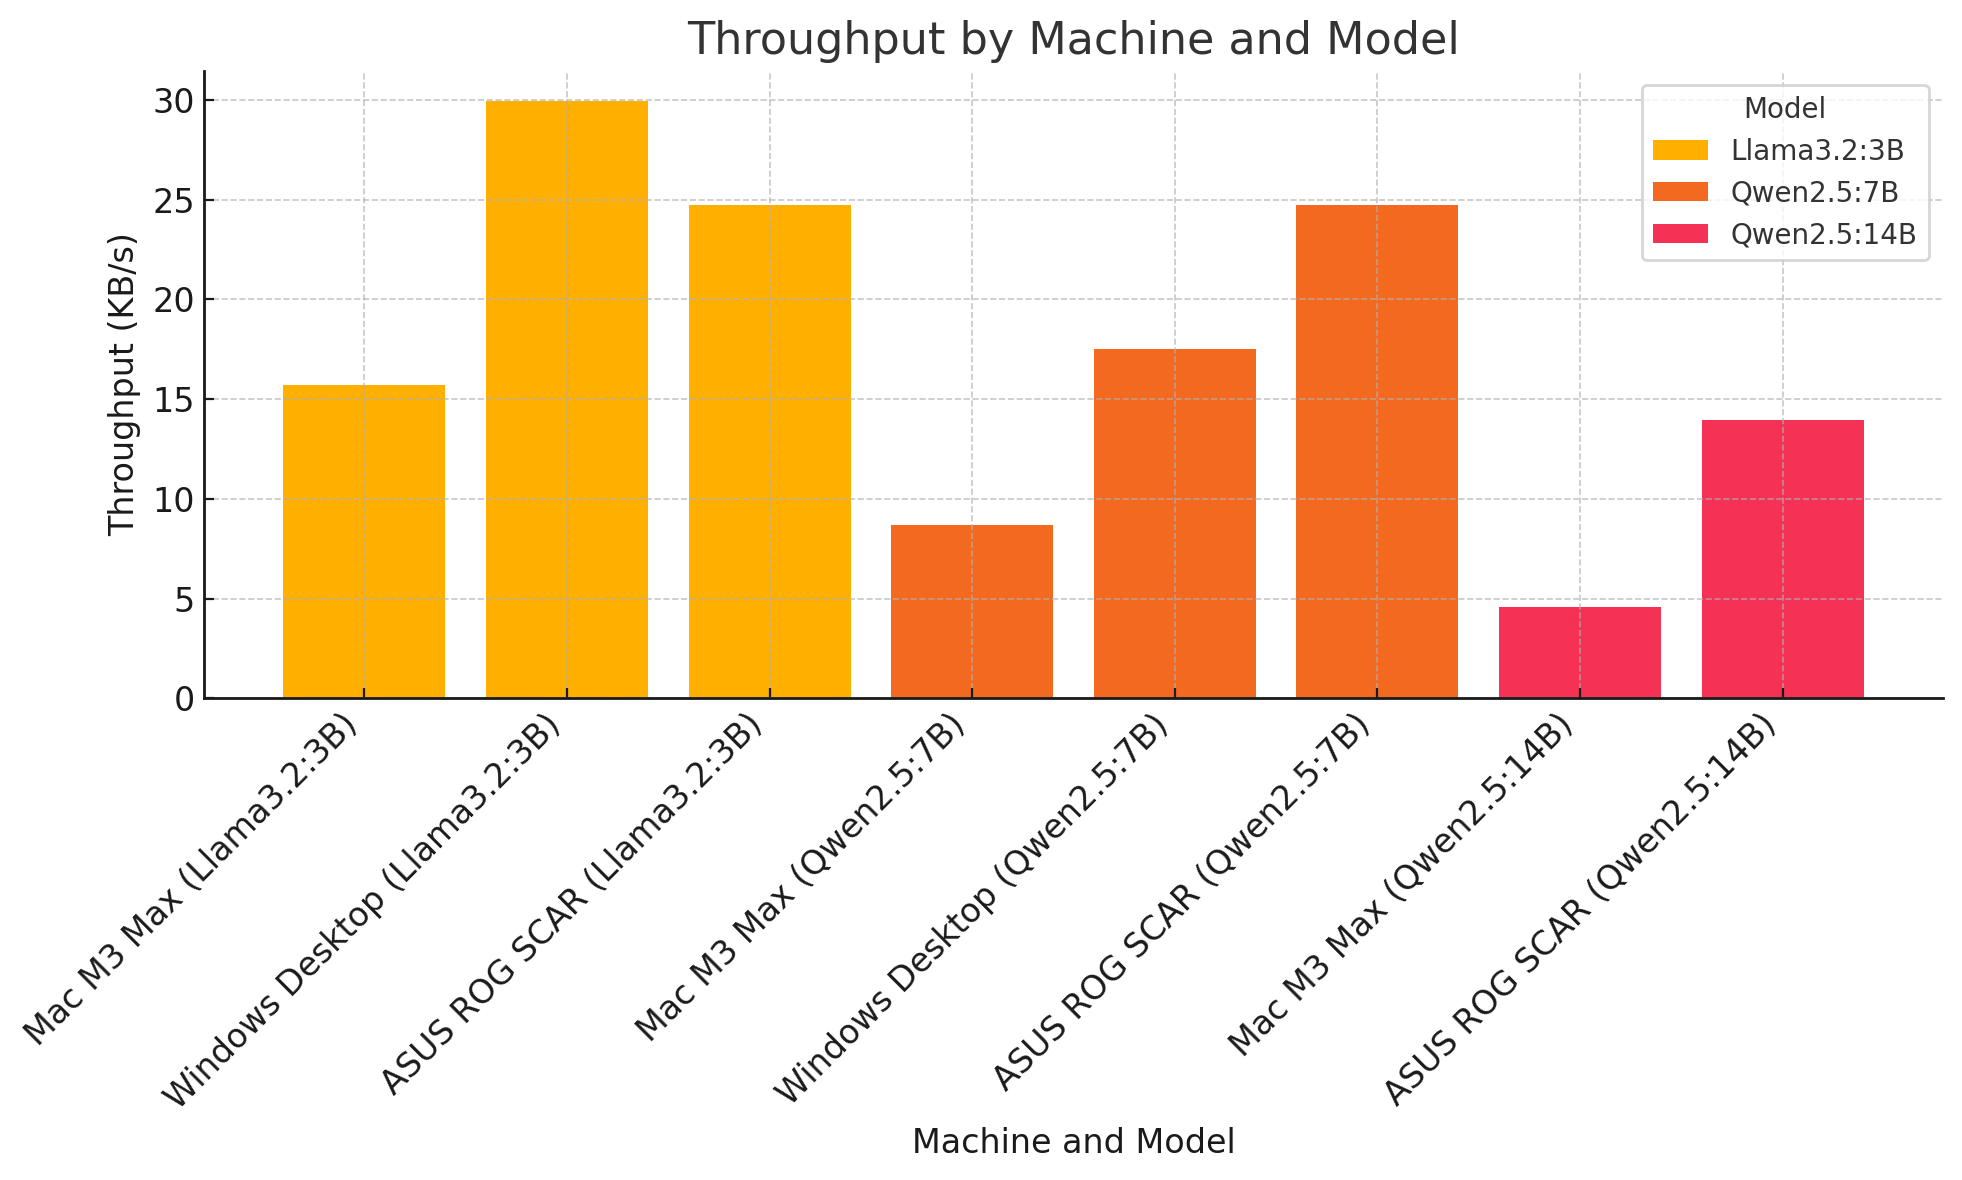
2. Throughput by Machine and Model
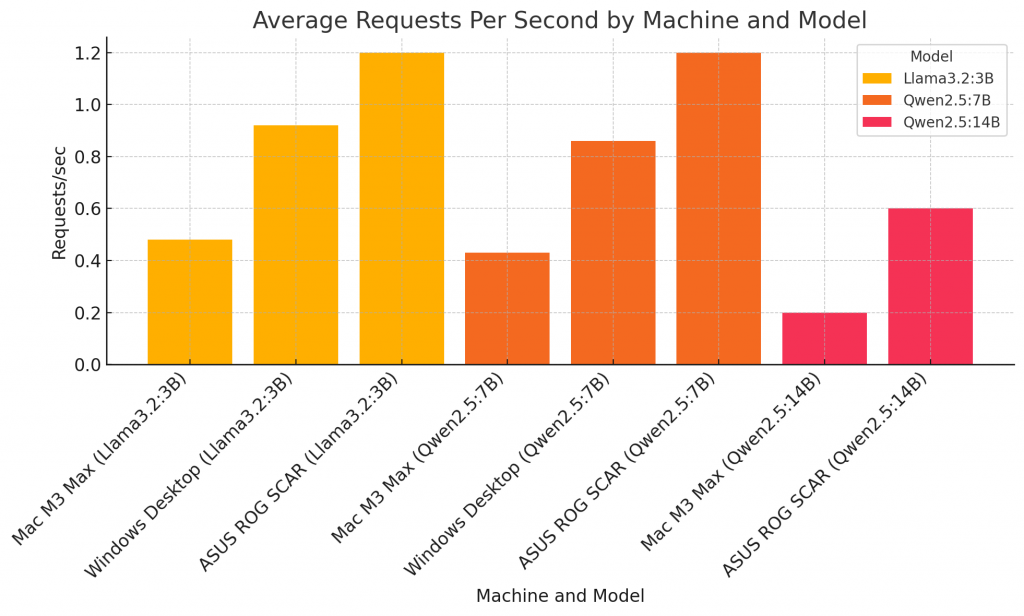
3. Average Requests Per Second by Machine and Model
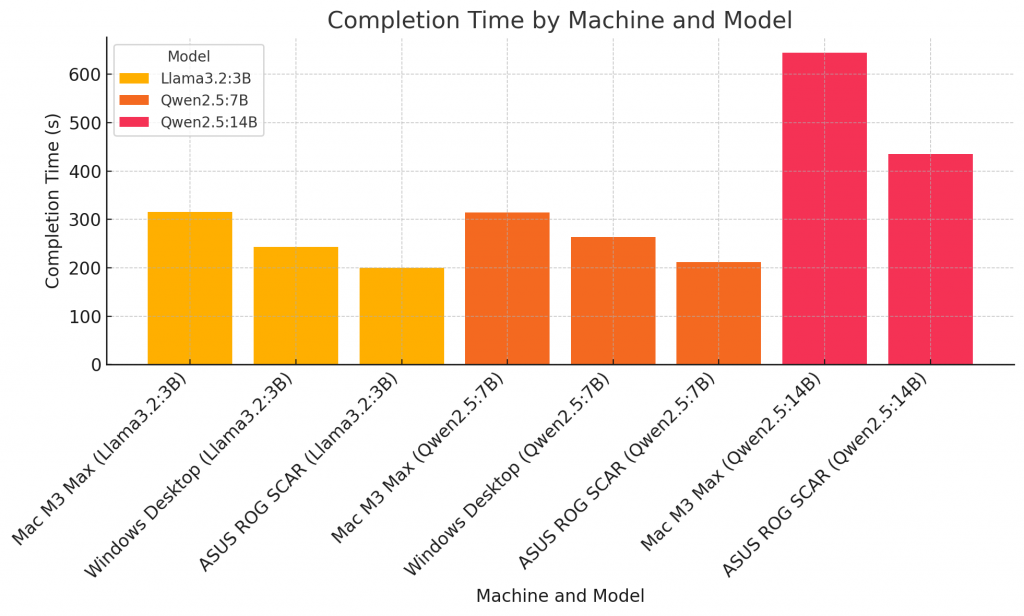
4. Completion Time by Machine and Model
Key Insights
ASUS ROG SCAR consistently outperformed other machines, demonstrating the power of the NVIDIA 4090 GPU and Intel i9-14900k CPU for AI inference workloads.
Windows Desktop provided solid performance but lagged slightly behind the ASUS ROG SCAR in concurrent tests. I included it in the tests just to create a stable baseline.
Mac M3 Max struggled in multi-request tests, with higher latency and lower throughput, highlighting optimization gaps for specific AI tasks.
The Qwen2.5:14B model showed significant performance drops across all machines, highlighting the increased demands of larger models.
Conclusion
This benchmarking analysis showcases the strengths and limitations of each machine under AI inference workloads. The ASUS ROG SCAR emerges as the best performer, while the Mac M3 Max shows potential in single-request scenarios. These results can guide hardware selection for AI developers seeking optimal performance.